

Cathie Wood’s ARK Invest bought roughly $77 million of crypto stocks in June, adding $44 million of Coinbase (COIN), $25.25 million of Circle (CRCL), and $8.2 million of Bullish (BLSH) during Bitcoin’s worst month in four years, according to ARK’s daily trade disclosures.
The purchases extend a thesis both Wood and other funds have held through every crypto downturn: public companies offer a regulated, equity-market way to own the digital asset cycle without holding the coins directly.
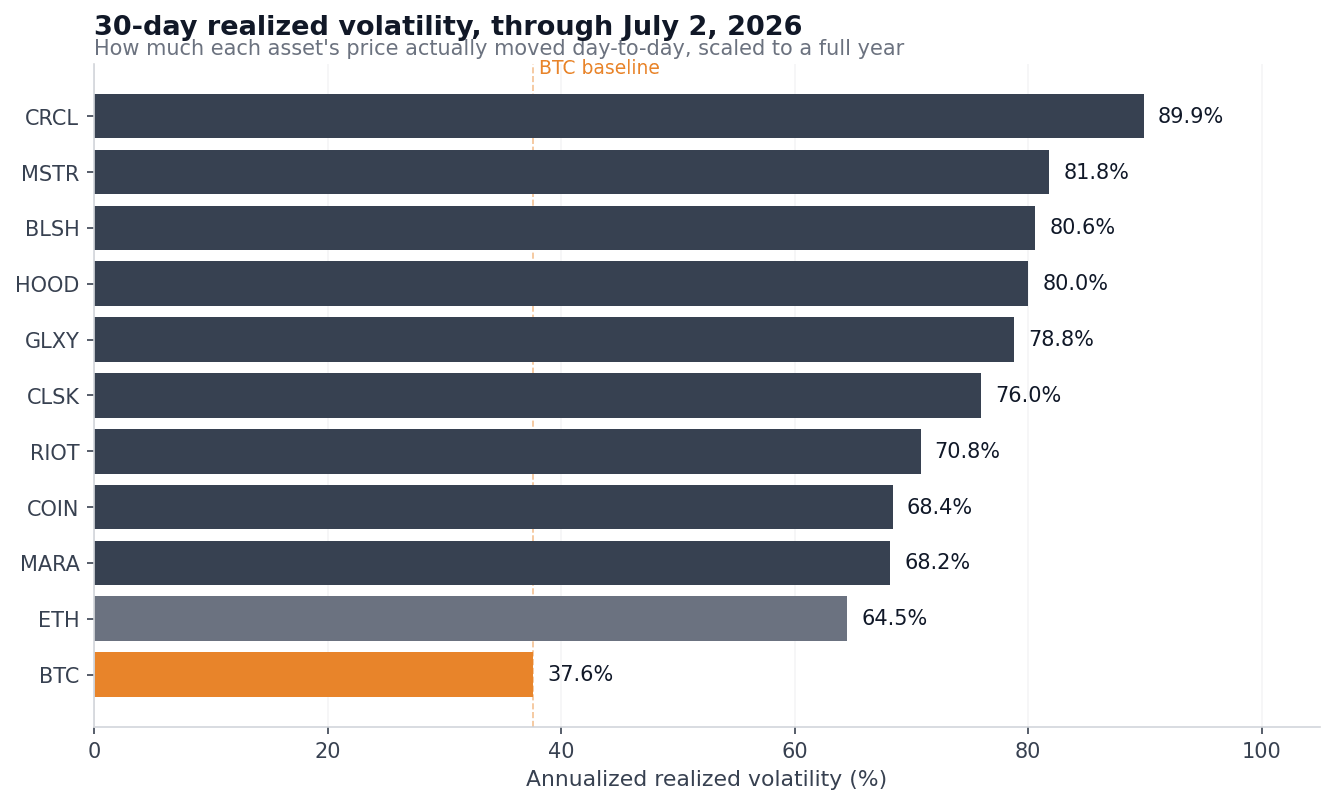
CryptoSlate’s analysis of daily price data through July 2 shows what that equity route actually cost this year. Across nine US-listed crypto stocks, annualized 30-day realized volatility, which measures how much a price actually moved day-to-day, scaled to a full year, ranged from 68% to 90%, roughly double Bitcoin’s 37.6%.
On a 90-day view, Circle’s reading is 103.6%, compared with Bitcoin’s 37.8%. Circle also sits 51.4% below its 2026 high, Strategy (MSTR) 48.6%, and Bullish 43.6%, all steeper falls than Bitcoin’s own 36.4% pullback from its January peak near $97,000.
That volatility gap alone could describe a leveraged Bitcoin bet, but the correlation data points in a different direction. Correlation measures how tightly two assets move together, on a scale from 1.00 (perfect lockstep) down to 0 (no relationship).
Over the last 90 trading days, Circle, Robinhood (HOOD), and Bullish moved in step with Bitcoin, with correlations of only 0.55 to 0.58, meaning Bitcoin’s daily swings accounted for roughly a third of these stocks’ daily moves. The rest is company-specific risk: quarterly earnings, competition, financing, and dilution from new share issuance.
Investors buying stocks for crypto exposure received partial exposure to the coin and, on top, a full second layer of equity-market risk.
Only one of these crypto stocks actually tracks Bitcoin
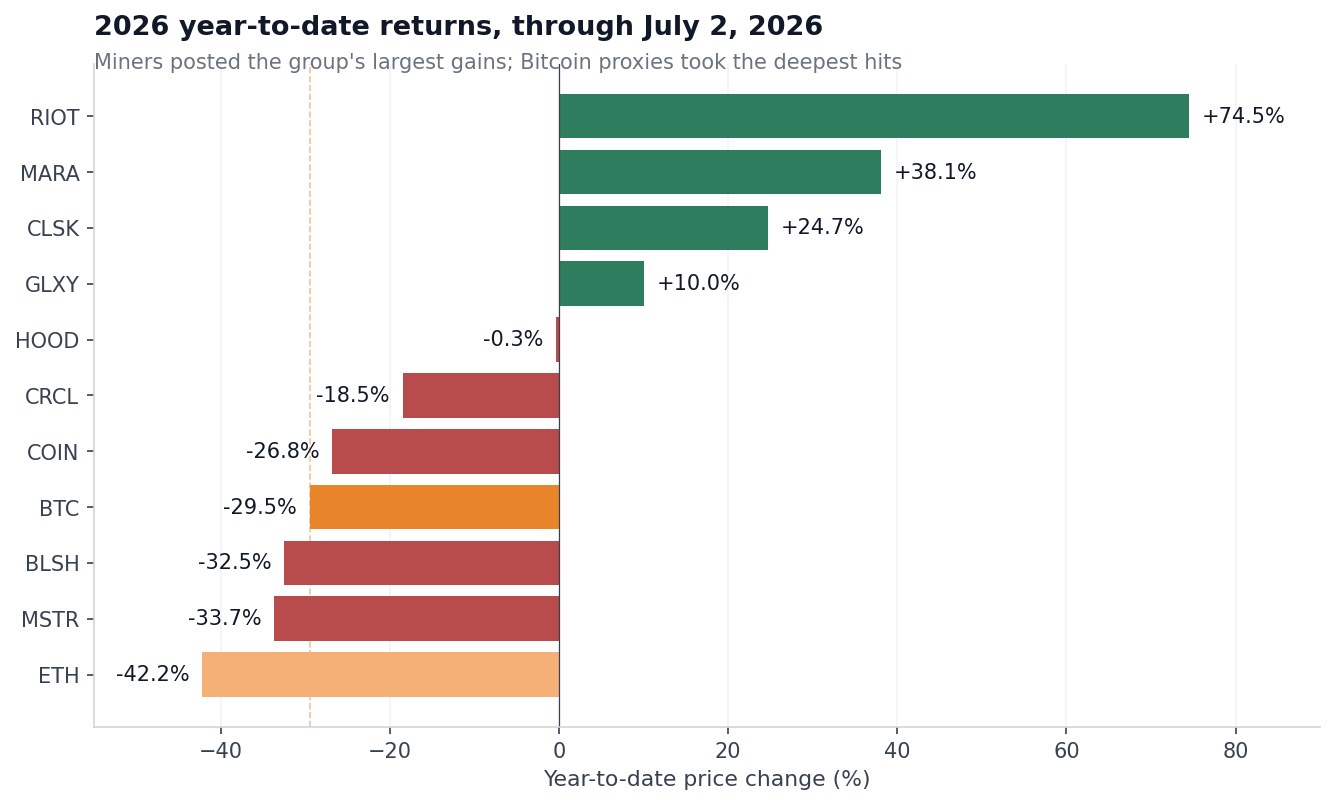
Here is the full picture from the price data. Year-to-date returns run from the last close of 2025. Beta measures how much a stock moves per 1% swing in Bitcoin, so a beta of 1.5 implies the stock rises about 1.5% when Bitcoin rises 1%, and falls further when Bitcoin falls. Betas and correlations are calculated over 90 trading days.
| Asset | 2026 return | Drawdown from 2026 high | 30-day realized vol | BTC beta | BTC correlation |
|---|---|---|---|---|---|
| BTC | -29.5% | -36.4% | 37.6% | 1.00 | 1.00 |
| ETH | -42.2% | -48.8% | 64.5% | 1.25 | 0.90 |
| COIN | -26.8% | -35.3% | 68.4% | 1.26 | 0.75 |
| HOOD | -0.3% | -8.5% | 80.0% | 0.96 | 0.58 |
| CRCL | -18.5% | -51.4% | 89.9% | 1.18 | 0.55 |
| BLSH | -32.5% | -43.6% | 80.6% | 0.89 | 0.58 |
| MSTR | -33.7% | -48.6% | 81.8% | 1.59 | 0.85 |
| GLXY | +10.0% | -28.3% | 78.8% | 1.44 | 0.71 |
| MARA | +38.1% | -16.5% | 68.2% | 1.20 | 0.65 |
| RIOT | +74.5% | -22.9% | 70.8% | 1.07 | 0.56 |
| CLSK | +24.7% | -32.9% | 76.0% | 1.23 | 0.67 |
Strategy is the one name where the Bitcoin proxy label fits. Its beta of 1.59, combined with a correlation of 0.85, describes leveraged Bitcoin exposure delivered through an equity. The stock behaved accordingly during the selloff, falling further than the coin in both the year-to-date figures and the drawdown from its 2026 high.
Coinbase comes closest to a balanced Bitcoin trade. It fell slightly less than BTC this year at -26.8%, with a beta of 1.26 and the second-highest correlation to Bitcoin in the group. Even so, its realized volatility ran nearly double Bitcoin’s, and the stock still trades 60.6% below its July 2025 record of $419.78. Anyone who bought near that top lost more than a holder who bought Bitcoin at its October 2025 record of $126,223.
Circle is the best example of equity risk masquerading as crypto exposure. Its correlation with Bitcoin is the lowest in the group, and its 90-day volatility is 103.6%, the highest. The reason showed up on June 30, when CRCL dropped 17.5% in a single session after the debut of Open USD, a rival stablecoin backed by more than 140 companies, including Coinbase, Stripe, Visa, Mastercard, and BlackRock.
Bitcoin’s price had almost nothing to do with that move. Stablecoin issuance is a payments and competition business, and Circle’s shareholders absorbed a competitive shock unique to that business.
Robinhood goes the other way and proves the same point. The brokerage is roughly flat for the year at -0.3%, with the shallowest 2026 drawdown in the group at 8.5%, because crypto is one slice of its much larger stock, options, and derivatives business. Diversification cushioned the slide somewhat, but HOOD delivered only a small fraction of the crypto exposure a buyer might have wanted on the way up.
The miners are the strangest result in the dataset. Riot gained 74.5% this year, MARA 38.1%, and CleanSpark 24.7%, while Bitcoin fell 29.5%. That outperformance came from the sector’s ongoing conversion into AI and high-performance computing landlords, a shift CryptoSlate has tracked as miners signed tens of billions of dollars in compute contracts and sold down their Bitcoin treasuries.
Their betas still sit above 1, so they swing with Bitcoin on any given day, though the year’s total gains came from AI hosting revenue that has nothing to do with the coin’s price.
The Bitcoin comparison base is far from calm. Volmex’s BVRV index of Bitcoin’s 30-day realized volatility bottomed at 24.5 in late May and climbed back to 41.6 by early July, after peaking at 68.7 during a separate February episode. Most of the stocks doubled that reading anyway.
Strategy shows where the equity layer breaks
Bitcoin holders face price risk. Equity holders in a Bitcoin-linked company face that plus everything else that can happen to a company: dilution, loss of the premium the market once paid, financing pressure, and changes to the capital plan.
Strategy experienced all of it inside a single month. In late June, the firm’s mNAV, or multiple of net asset value, fell below 1 for the first time. mNAV compares a company’s enterprise value (its market capitalization plus debt, minus cash) to the market value of Bitcoin on its balance sheet.
A value below 1 means the market values the entire business at less than the cash it holds. Strategy held 847,363 BTC as of its June 22 disclosure, worth roughly $50 billion at the moment mNAV fell through the threshold.
Falling below 1 breaks the model that built the company. Strategy’s flywheel, the self-reinforcing cycle at the core of the business, depended on the stock trading at a premium to the value of its Bitcoin holdings.
That premium allowed Michael Saylor’s team to issue new common and preferred shares at prices above the underlying coin’s value, then use the proceeds to buy more Bitcoin, adding Bitcoin-per-share for existing holders on every raise.
Below an mNAV of 1, the same process destroys value, because the company would be selling Bitcoin exposure at a discount to the coins it already holds. CryptoSlate reported on this in January when the treasury sector split into premium and discount operators.
Strategy’s market capitalization stood at $29.54 billion at the end of June, less than half its 2024 peak above $71 billion, and all four of its preferred stock series, separate share classes that pay fixed dividends and helped fund Bitcoin purchases, traded near record lows.
The company’s response confirms how different equity risk is from coin risk. On June 29, Strategy announced a share buyback program and authorized up to $1.25 billion in Bitcoin sales to build a liquidity cushion for preferred dividends and interest expenses. That came weeks after its first Bitcoin sale since 2022, a small 32 BTC disposal on June 1.
Shares closed 12.6% higher on the announcement, snapping an eight-day losing streak. The largest corporate holder of Bitcoin now has board-approved authority to sell into a weak market because its financing structure requires cash that the equity market has stopped providing on the old terms. A direct Bitcoin holder is not tied to that constraint.
That is the context for ARK’s buying. On June 25 alone, Wood’s funds added 35,023 Robinhood shares worth about $3.27 million alongside fresh Coinbase, Circle, and Bullish positions as all four crypto stocks fell.
Wood pairs the purchases with a seven-figure long-term Bitcoin target, and at current prices, her funds are accumulating businesses at steep discounts to 2025 valuations.
The data tells us what those businesses actually are: MSTR is levered Bitcoin exposure with dilution risk attached; Circle is a payments company in a stablecoin market-share fight; and Robinhood is a diversified brokerage with a crypto sideline. Buying all of them is a portfolio bet across different business models, with crypto exposure ranging from amplified to almost incidental.
Every stock in the group has an investment case on its own terms. Coinbase beat Bitcoin this year, Robinhood protected capital, and the miners posted the best returns in the sector.
But does the equity wrapper reduce risk relative to owning Bitcoin directly? Across nine names, the wrapper either amplified Bitcoin’s swings or added a second layer of company-specific risk with little to do with the coin’s price.
The crypto stocks that protected capital this year did so by growing revenue streams with their own drivers, meaning AI hosting contracts, brokerage flows, and payments products, with Bitcoin a smaller input to the outcome.


